The information on this page is not a personal recommendation and does not take into account your personal circumstances or appetite for risk.
Trend
A basic but essential element of technical analysis, key for ensuring trading success. Nothing more than the general direction of a price, it is a critical piece of information to be aware of. The short-term is always part of the longer-term, and so knowledge of the underlying trends and bigger picture is key.
If a 1-week graph shows a rising price one might be tempted to ride the momentum, taking a long position. A 3-month graph might, however, show the price within a multi-month rising channel, fast approaching the channel’s upper trendline which has served as resistance several times already.
This could mean the short-term rising trend near its end and a reversal to a new short-term trend (return journey to channel’s lower trendline of rising support) imminent, offering better trading potential (risk vs reward).
Don’t forget that the 3-month graph will also be within it’s own longer-term trend and could itself be losing momentum and a reversal be on the cards.
Essential
Evaluating trends and trendlines on longer-term graphs is essential before trading, and more often than not a good money saving exercise. Should shares be approaching support/resistance for the tenth time on a 2yr chart, the chances are that this level remains support/resistance. However, that may not be visible on a 1-month chart. Traders should verify long-term graphs to be sure.
Moving averages also indicate trend and can serve as support and resistance so should be checked before trading, to avoid going short just above the traditionally supportive and commonly-used 200-day moving average.
Likewise, when taking a long-term bullish position, while one might be able to stomach being offside for a short while, there is no point in this being the case from the off. If the short-term graph highlights the immediate trend in the opposing direction, and likely lasting a while longer, is it not more prudent to wait for a better entry point to maximise the profit potential and keep capital freed up for longer
Example
The below graphs highlight the UK 100, from the very short-term to the very long term to give you an idea of how different things can look from one graph to the next.
Chart 1 – 1 day, tick by tick
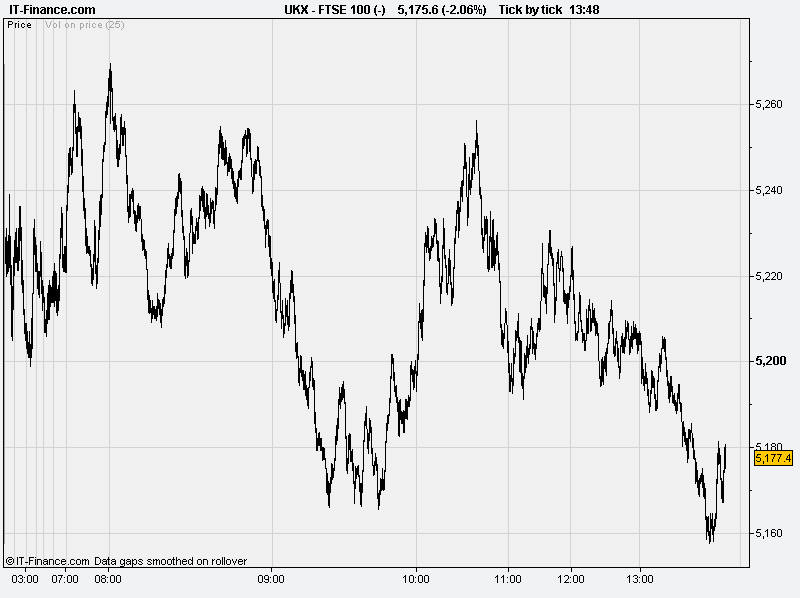
Chart 2 – 1 week, 5 minutes
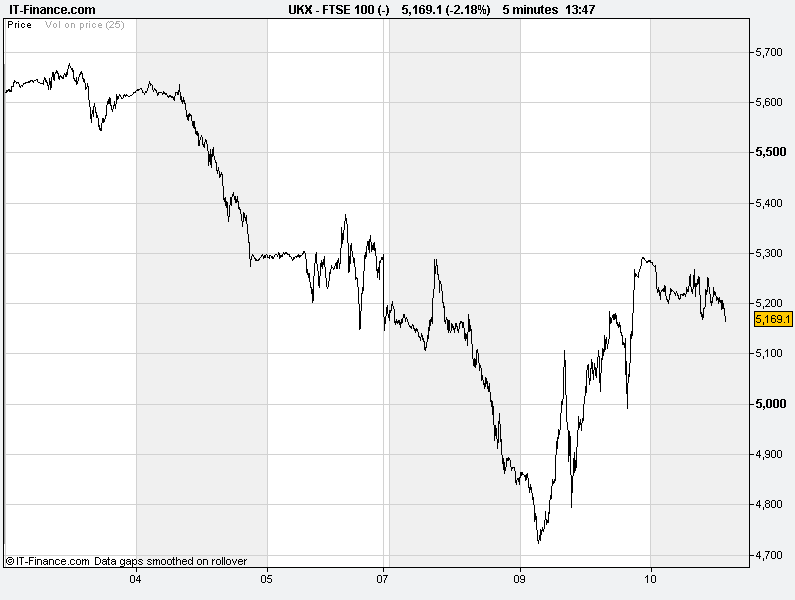
Chart 3 – 1 month, 15 minutes
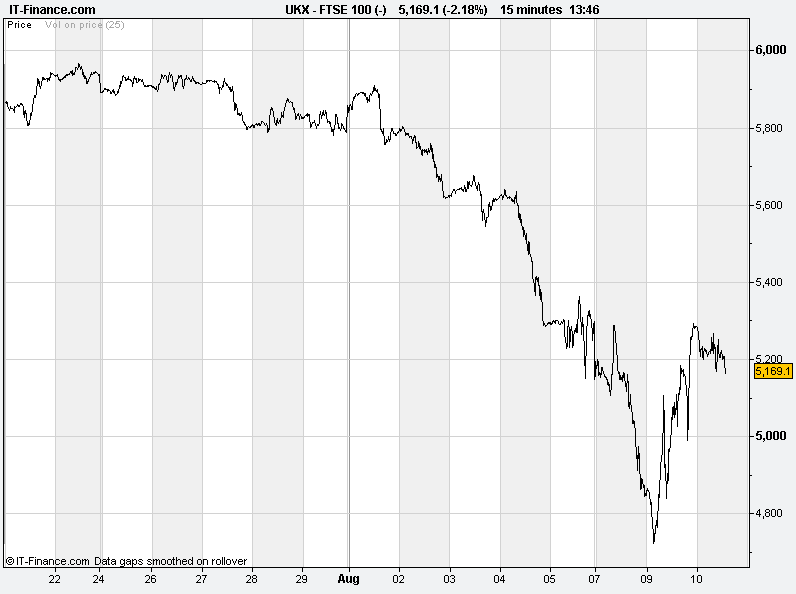
Chart 4 – 3 month, hourly
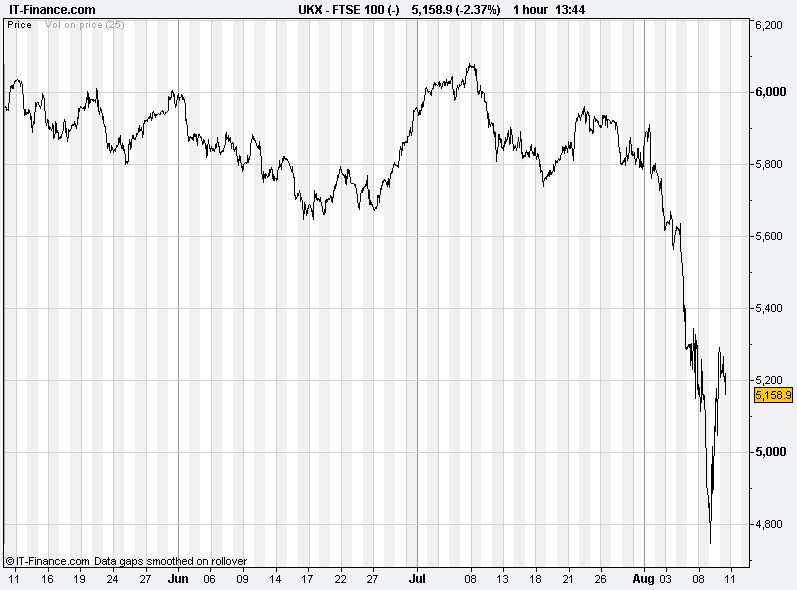
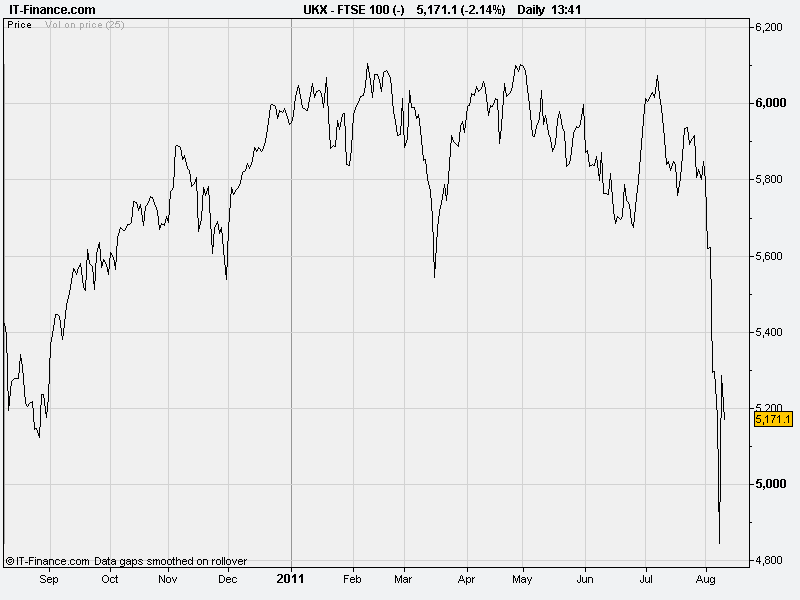
Chart 5 – 1 year, daily
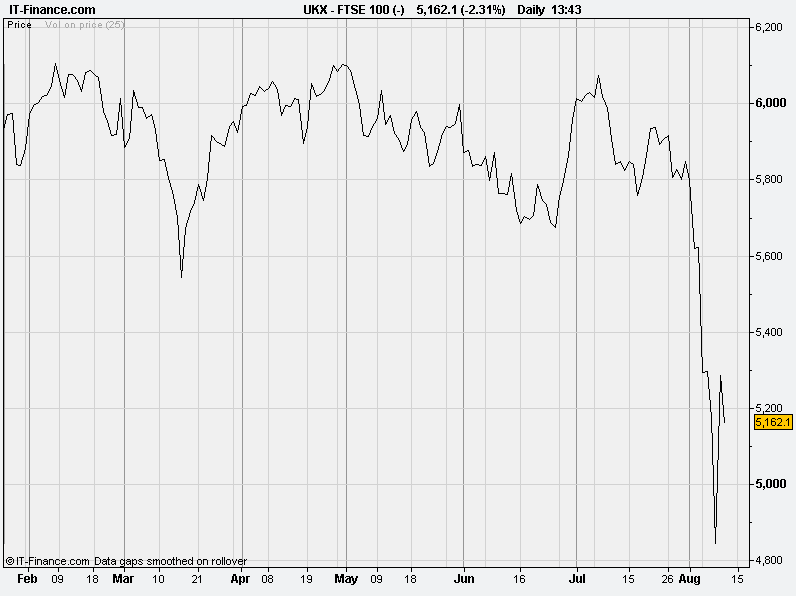
Chart 6 – 2 year, daily
Conclusion
Awareness of trend is hey for increasing the chances of a trade being profitable. Some are easily identifiable, others more difficult to pick out. Whatever your investment/trading horizon, it is always worth looking at several time frames to check if an idea is good or bad or just worth waiting a little longer for.
Caveat
Individual technical indicators shouldn’t be relied upon in isolation for trading decisions, however strong the signal. Others should be consulted for extra help, while price (price, price patterns, support/resistance, moving averages, trendlines) and volume should confirm continuation or change of trend. Trend should always be respected as pre-empting a change can prove costly.