The information on this page is not a personal recommendation and does not take into account your personal circumstances or appetite for risk.
Momentum is a key indicator used by traders to decide whether a trend will continue or reverse. As the old trading adage goes, ‘the trend is your friend’.
Momentum works with any tradeable asset including shares, currencies, commodities and indices.
Introduction
Momentum indicators appear in charting packages under ‘Momentum’ or ‘Rate of Change (ROC)’ and track the difference in price over 12 days to display the acceleration and deceleration of price rises and falls before it is visible via price.
Explained
Momentum implies continuation of trend and so if a trend has momentum we assume it is likely to continue (although not always the case; past performance no guarantee of future returns).
Momentum indicates a trend when rising and the price is in an uptrend, or falling when the price is in a downtrend.
Trading Signals
Buy – momentum crosses up through the central line and shares are rising. Sell – momentum crosses down through central line and shares are falling.
Failure by momentum to make a new high/low followed by a fall/rise can be taken as potential sell/buy signal, although price may keep rising/falling for a little longer – momentum not yet gone negative. Price confirmation (break of trendline/support/resistance, price cross of a moving average etc) needed before trade decision.
Extreme highs/lows usually mean short-term continuation of trend.
Divergence: When Momentum plateaus and begins to turn down, but price is still rising, we can assume price will begin to lose steam, and turn down itself, mirroring momentum – negative divergence. If momentum turns up before price bottoms out, this is positive divergence.
Momentum belongs to a group of indicators called oscillators which move around a central point. How far the indicators rise/fall depends on the strength of the trend.
Example 
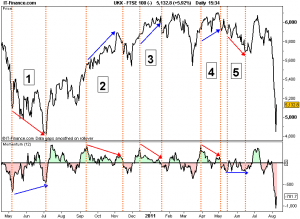
The graph highlights several instances where the UK 100 ’s momentum flagged up an impending change in price trend.
1. Index makes lower low, momentum makes higher low: Positive divergence.
2, 3 & 4 Index makes higher highs, momentum makes lower highs: Negative divergence.
5. Index makes lower low, momentum finds support: Positive divergence.
Momentum does not call the top or the bottom but helps flag up some of the better quality trading opportunities.
Summary
Momentum is a key indicator within the technical analysis, providing an additional signal to price. Its use is advantageous in increasing the chances of a trade being profitable. The price may be screaming Buy (price pattern, volume) but momentum may suggest the trend losing steam.
Caveat
Individual technical indicators shouldn’t be relied upon in isolation for trading decisions, however strong the signal. Others should be consulted for extra help, while price (price, price patterns, support/resistance, moving averages, trendlines) and volume should confirm continuation or change of trend. Trend should always be respected as pre-empting a change can prove costly.