The information on this page is not a personal recommendation and does not take into account your personal circumstances or appetite for risk.
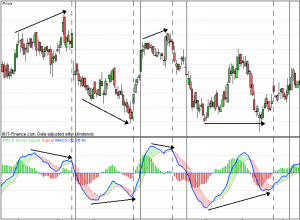
MACD is a trading tool that can be used to provide buy and sell signals on shares, commodities, currencies and indices. See the chart below. In short, the blue line crossing above the dotted red is a buy signal, the red dotted line crossing above the blue is a sell signal.
Introduction
Moving Average Convergence Divergence (MACD) is a momentum indicator. MACD is an oscillator, plotting the difference between two trend-following indicators (exponential moving averages). MACD moves around a zero line as the two MAs converge, cross and diverge. A signal line is used for interpretation. MACD brings together momentum and trend, with signals generated from MACD crosses with the signal line, MACD crosses of the zero line and the MACD divergence from the share price.
African Barrick Gold Shares – An Example

Arrows denote divergence; Dashed line denotes signal line crossover; Solid line denotes zero-line crossover
Parameters
Standard MACD uses 12 and 26-day Exponential Moving Averages (EMAs). A signal line (9-day EMA of MACD) highlights turns in MACD and a histogram is used in the background to more clearly show the difference between the two EMAs. The histogram is above/below zero depending on whether the MACD is above/below its signal line.
Signals
MACD is concerned with convergence and divergence of the EMAs (when they move towards and away from each other). Whichever happens is based on the movement in the shorter term (12-day) MA compared to the longer term (26-day) as the shorter term MA is more reactive to changes in price.
As the MACD oscillates (moves around) the zero line (12-day EMA crosses 26-day), three types of signal can be produced; MACD Zero-line Crossovers occur when the 12-day EMA crosses the 26-day. If the MACD is positive (above zero), the 12-day EMA is above the 26-day. As prices rise, the divergence between the MAs increases – upward momentum rising. Buy signals are generated when the MACD crosses above zero from oversold (below zero). When the MACD is negative (below zero) the 12-day EMA is below the 26-day. As prices fall faster, the divergence between the two EMAs increases – downward momentum rises. A Sell signal occurs when the MACD crosses zero from overbought (above zero). The further the indicator moves from the origin, the stronger any subsequent crossover signal should be.
Single-line Crossovers
The Signal-line (9-day EMA of MACD) trails the MACD and highlights turn in the MACD. When the MACD turns down and crosses the signal line – a sell signal is generated. When the MACD turns up through the signal line – a buy signal is registered. These crossovers are very common and so can and should not be relied upon in isolation. In fact, confirmation should always be sought from other indicators (see caveat on page 2). At positive/negative extremes, signals should also be taken with a pinch of salt as prices could continue to move in the same direction for a while longer. Additionally, while signals may be false, momentum should eventually slow and so one can be on the watch for an eventual zero-line crossover.
Divergence
This occurs when the indicator diverges from the share price. Bullish divergence occurs when a share price records a lower low while its MACD (or any other indicator for that matter) registers a higher high. The new low for the share confirms the current downtrend, however, the indicator’s higher high does not, and suggests less downside momentum. Bearish divergence occurs in reverse. Divergence can warn of a potential future reversal. It is to be used with caution, however. In a strong uptrend, bearish divergence is common place, and vice-versa, as momentum rises strongly initially and then falls off while shares continue to move upwards albeit at a slower rate. Divergence can be very common in a strong trend and take a long time to reverse.
Conclusion
MACD is another key indicator in technical analysis and part of the momentum family, offering good quality signals derived from the underlying share price. As always, an indicators use is advantageous in increasing the odds that a trade will be ultimately prove profitable. MACD is always worth a cursory glance in order to check if it supports other momentum indicators and or share price moves.
Caveat
Technical indicators should never be relied upon in isolation for trading decisions, however strong a signal may be. Ultimately they are one of many indicators, which may, in the majority, be pointing the other way. Always use indicators such as moving averages in combination with other indicators (trendlines, price, price patterns, support/resistance, oscillators, etc) to assist in the final trading decision. Lastly, the current trend of a share should always be respected – pre-empting a change in trend more often than not proves costly.