This report is not a personal recommendation and does not take into account your personal circumstances or appetite for risk.
The biggest news of the week was the outbreak of the novel Coronavirus in China, which has not only infected close to 500 people in at least 4 countries with 17 confirmed deaths, but also jump-started a global selloff in the stock markets. The selloff contagion also spread to the UK 100 , prompting a 3-day losing streak which was only snapped yesterday after the Queen assented to the UK Brexit Withdrawal Bill.
This now paves the way for the Bill to be signed into law, clearing the way for the UK to exit the EU officially on January 31.
Top gainers on the UK 100 for the week so far include the following:
Stocks like BAE Systems and Intertek also made the gainers’ chart, recording gains of 3.46% and 3.19% respectively.
On the losers’ chart, NMC Health regained the top position which it held for much of December 2019 by posting a drop of 10.77% as at the time of
writing. Other stocks in mining and luxury goods also had a pretty bad week, which is why we have the following stocks coming in the top 7 losers for the week:
All price gains and losses are current as at 9:15am GMT.
Technical Outlook for UK 100
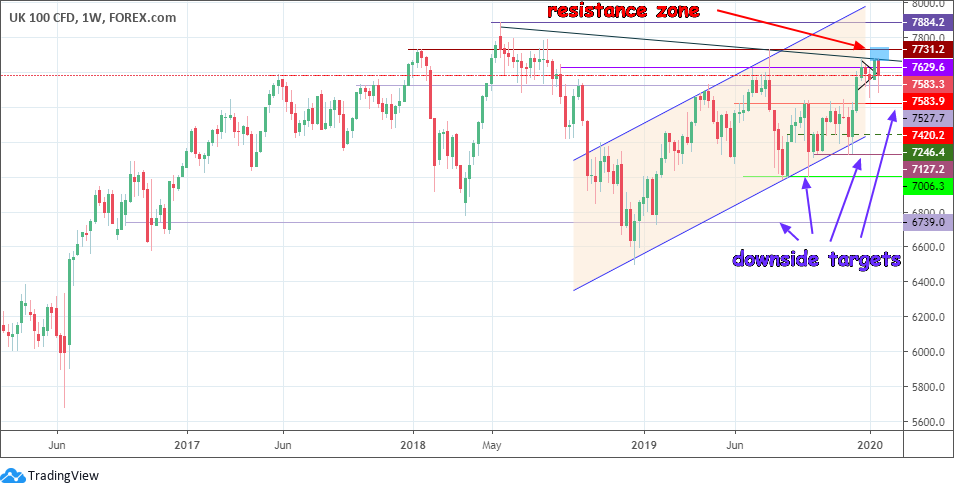
Having broken the small symmetrical triangle to the upside as shown in last week’s chart, the UK 100 was unable to breach the identified resistance zone, stalling at the descending trendline which connects the highs of price action from early 2018 to date on the weekly chart, close to the horizontal resistance level at 7731.2.

UK 100 Weekly Chart: January 24, 2020
The resistance level at 7731.2 therefore remains intact. Price is now pushing downwards and is trading around the 7583 – 7605 band on the day. This allows it to continue flirting with the previous resistance-turned-support at 7583.9.
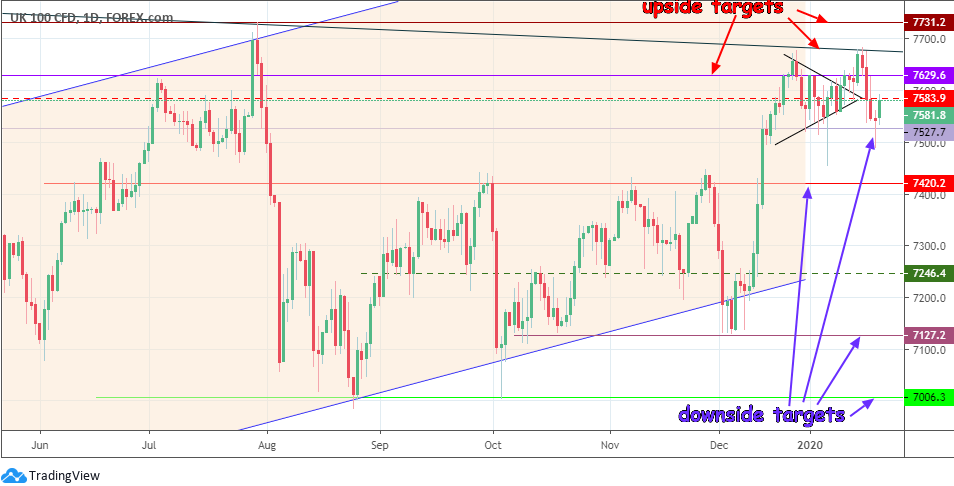
The daily chart reveals a clearer picture of the price action. Friday’s trading session has kicked off on a bullish note, which continues yesterday’s claw back of the losses. Yesterday’s daily candle shows that the market started off on the losing path, but was able to claw back some losses. This price move turned that candle into a pinbar that bounced off the 7527.7 support level.

UK 100 Daily Chart: January 17, 2020
Price is now testing the 7583.9 minor resistance (previous highs seen at 16 July, 23 July and 19 Dec 2019). Price must break this area to the upside with a 3% penetration to be able to target the next resistance level at 7629.6 (3 July/23 Dec 2019 and 2 Jan 2020 highs). Above this area, we have the previous resistance zone which lies between the descending trend-line and the 7731.2 resistance line (previous weekly highs of Jan 8 2018 and July 29, 2019 as well as a cluster of highs seen June and August 2018). Therefore, any further upside move on this pair which seeks to target the resistance at 7884.2 (previous high of May 21, 2018) and the channel’s upper border must breach 7731.2 decisively.
On the flip side, failure to break above 7583.9 or 7629.6 may lead to a pullback which may aim for the downside targets at 7527.7 (previous weekly candle highs of March 18, May 6, 13 and 20) or even 7420.2. Other support areas at 7246.4 and 7127.2 remain valid target points if downside pressure persists in the coming weeks.
Bulls
Bulls still need to see the resistance zone at 7731.2 breached to the upside for the UK 100 to target 7884.2.
Bears
A price push below 7527.7 is what opens the door for further bearishness that targets the support levels at 7420.2 and possibly 7246.4.
This research is produced by Accendo Markets Limited. Research produced and disseminated by Accendo Markets is classified as non-independent research, and is therefore a marketing communication. This investment research has not been prepared in accordance with legal requirements designed to promote its independence and it is not subject to the prohibition on dealing ahead of the dissemination of investment research. This research does not constitute a personal recommendation or offer to enter into a transaction or an investment, and is produced and distributed for information purposes only.
Accendo Markets considers opinions and information contained within the research to be valid when published, and gives no warranty as to the investments referred to in this material. The income from the investments referred to may go down as well as up, and investors may realise losses on investments. The past performance of a particular investment is not necessarily a guide to its future performance.
Comments are closed.