This report is not a personal recommendation and does not take into account your personal circumstances or appetite for risk.
The week kicked off with the announcement by pro-Brexit UK politician Nigel Farage that his party would not be standing against Conservative candidates in the upcoming elections. He however reiterated on Wednesday that his party would battle for every Labour Party seat. The announcement unsettled the markets a little bit, but did not have a lasting impact.
More of the impact has come from some of the economic indicators, most notably the downbeat GDP data, lower Consumer Price Index (CPI) data as well as poor retail sales data. All of these weak indicators have strengthened the case for a rate cut by the Bank of England come early next year.
The UK 100 started the week on a bad note, but has been able to claw back on some of the losses it has sustained. However, it is still trading lower as we head into the last day of the trading week.
This week’s top gainers are:
The top losers for the week include:
Technical Outlook for the UK 100
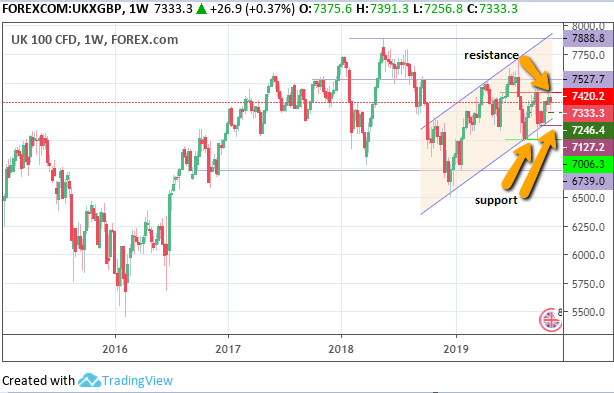
Price action on the monthly chart is still trend upwards technically speaking. However, the presence of lower highs continues to indicate a possible stall of this uptrend. The weekly chart shows that the UK 100 is posting lower highs as well, which confirms the stall of up-trending price movement.
The previously identified horizontal resistance (7420.2) and support levels (7127.2 and 7006.3) within the channel on the weekly chart continue to exist. The upsurge of the UK 100 was unable to breach this resistance level, leading to the price retreat seen this week.

UK 100 Weekly Chart: November 15, 2019
With the price rejection at the 7420.2 resistance, the price action continues to fall within the range that is defined by 7127.2 acting as the floor, and 7420.2 acting as the ceiling. Below the 7127.2 floor, we have a minor support where previous lows of September 3, September 24 and October 31 are found; this is at 7246.4.

UK 100 Daily Chart: November 15, 2019
Therefore, if price breaks 7420.2 to the upside, it opens the door to 7527.7. This upside target of 7527.7 is the level where price highs of the weekly candles of March 18 as well as May 6, May 13 and May 20 are found. This breakout can only confirmed by a 3% penetration close on the weekly chart, or a double candle close on the daily chart above 7420.2. If further upside momentum persists, a break of 7527.7 clears the way for a test of the channel’s upper border.
On the flip side, a downside break of 7127.2 breaches both the floor of the range and the channel’s trend-line, thus setting up a potential breakdown of the channel. Again, a double candle close or a 3% penetration to the downside must be in place to confirm the breakdown. This breakdown would open the door to the 7006.3 price level (previous lows of the weekly candles of August 19 and August 26).
Bulls
Bulls would continue to watch the 7240.2. This is the price level that needs to be broken for further upside to be seen on the UK 100 .
Bears
Bears would continue to look towards a dip below 7127.2. A break of this support is what is required for a breakdown of the channel and further downside to 7006.3 and 6739.0.
Prices to watch: 7240.2 (bulls) and 7127.2.5 (bears).
This research is produced by Accendo Markets Limited. Research produced and disseminated by Accendo Markets is classified as non-independent research, and is therefore a marketing communication. This investment research has not been prepared in accordance with legal requirements designed to promote its independence and it is not subject to the prohibition on dealing ahead of the dissemination of investment research. This research does not constitute a personal recommendation or offer to enter into a transaction or an investment, and is produced and distributed for information purposes only.
Accendo Markets considers opinions and information contained within the research to be valid when published, and gives no warranty as to the investments referred to in this material. The income from the investments referred to may go down as well as up, and investors may realise losses on investments. The past performance of a particular investment is not necessarily a guide to its future performance.
Comments are closed.