The information on this page is not a personal recommendation and does not take into account your personal circumstances or appetite for risk.
This is a basic introduction to chart types. If you know the basics definitions, we would suggest skipping this page.
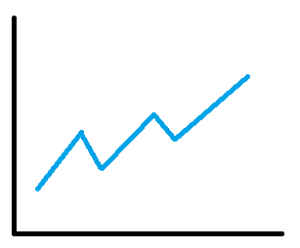
Line Chart

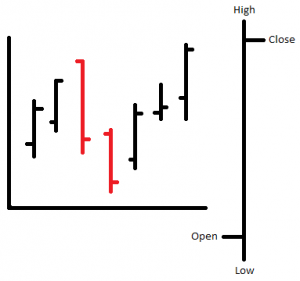
Bar Chart

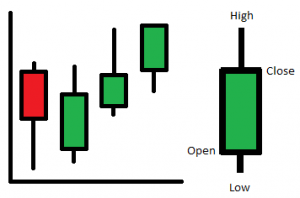
Candlestick Chart

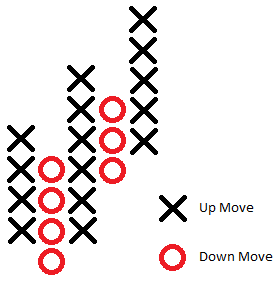
Point & Figure Chart

Time frames
All charts can be configured for any time-frame and interval (e.g. daily tick chart; 1-week 5 mins; 1-year daily) except Point & Figure which is focused on price moves and not time. This allows one to look at short/medium and long-term periods before deciding on the trading period of interest. Most chart packages allow users to customise graphs.
Caveat
Individual technical indicators shouldn’t be relied upon in isolation for trading decisions, however strong the signal. Others should be consulted for extra help, while price (price, price patterns, support/resistance, moving averages, trendlines) and volume should confirm continuation or change of trend. Trend should always be respected as pre-empting a change can prove costly.