This report is not a personal recommendation and does not take into account your personal circumstances or appetite for risk.
The other week my colleague Dan talked about trading ranges. Having had a good response to the topic I thought I’d build on the theme by looking at why they exist, how they can be identified and, more importantly, how you can capitalise when they appear on the charts.

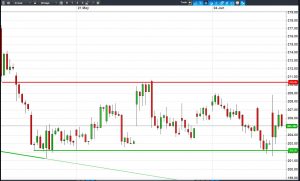
First things first. A range requires boundaries (think floor and ceiling) which means the existence of Support and Resistance. These are identifiable on the price chart (applicable to any tradeable asset but we’ll concentrate on shares) when you can draw a horizontal trendline across the highs and below the lows, over any period.
Once drawn, your annotations will highlight how the price has a tendency to bounce from certain levels, up off the lows (support), and fall from certain levels, back from the highs (resistance). The more times the shares turn at the trendlines, the more you assume the trend can be trusted to continue.
Support and resistance is merely a visual representation of the relative appetite of buyers and sellers, at differing price levels within the identified range. The turnarounds/reversal at the top and bottom tend to result in the most intense trading within the range, as enthusiasm shifts from bullishness (positive, optimistic, buying) to bearishness (negative, pessimistic, selling). It’s all about simple psychology among the different traders involved, and how their corresponding appetite rises and falls.
When a share price begins to rise from the bottom of a range those who are already Long (bought shares way back, hoping for the price to rise) are happy with their profit. They buy more on any pullbacks, hoping the shares go all the way back to the top of the range. This contributes to buying pressure.
As the shares rise those who do not have a position, but have been watching the shares closely (maybe they traded it before, maybe they are new), get a case of FOMO (Fear Of Missing Out). They are desperate not to miss out on a rally back to the channel ceiling. More buying pressure.

As the shares climb higher those with unsuccessful short positions (they were hoping for the shares to fall) give up, scared of having to take an even bigger loss. Guess what? They have to buy shares to close the position. Even more buying pressure. They may even admit they were wrong, reverse course and go Long, hoping to capitalise on the upside that remains to the prior highs. Even more buying pressure. All this gradual increase in buying pressure helps the shares rise back towards the prior highs where…… the reverse can happen and the shares start to turn down again.
All those who bought the shares want to close out with as much profit as possible. Selling pressure. Those waiting to trade the shares short again (profit from another share price fall back to the range floor) do so. More selling pressure. As the shares begin to succumb to this new selling pressure those who bought previously, but missed out on selling at the top, are petrified at seeing their profits erode, so they sell. Even more selling pressure.
Those who mistakenly bought too close to the top, now sitting in a loss, are terrified of this loss getting worse, so they sell. Even more selling pressure. As the shares fall further, those who missed out on shorting at the top sell short, get a similar case of FOMO and want to ride the shares down. Guess what? Even more selling pressure. Until the shares get back to the channel floor.
And rinse and repeat. For as long as the range persist. And then when the range does eventually give way, you are blessed with a clear tradeable bullish breakout or bearish breakdown. The longer the range has gone on for the more powerful the break can be, due to all the vested interest that has built over time, providing you and newcomers with a fresh opportunity to trade and profit from the subsequent rally or decline. Everyone’s a winner.
A large part of my job is trawling the charts, looking for the latest tradeable opportunities for Accendo clients, which we published via our daily Another Level and Trade Idea publications. To know which share price we have highlighted as an example, which ranges we’re looking at currently, and to be kept updated with the latest tradeable ranges, trends, breakouts and breakdowns get access to our award-winning research.
Let us do the hard work, so you can make easy decisions. You never know, do well enough and you could be driving round in a new Range.
Enjoy your weekend,
Mike van Dulken, Head of Research, 8 Jun 2018
This research is produced by Accendo Markets Limited. Research produced and disseminated by Accendo Markets is classified as non-independent research, and is therefore a marketing communication. This investment research has not been prepared in accordance with legal requirements designed to promote its independence and it is not subject to the prohibition on dealing ahead of the dissemination of investment research. This research does not constitute a personal recommendation or offer to enter into a transaction or an investment, and is produced and distributed for information purposes only.
Accendo Markets considers opinions and information contained within the research to be valid when published, and gives no warranty as to the investments referred to in this material. The income from the investments referred to may go down as well as up, and investors may realise losses on investments. The past performance of a particular investment is not necessarily a guide to its future performance. Prepared by Michael van Dulken, Head of Research
Comments are closed.